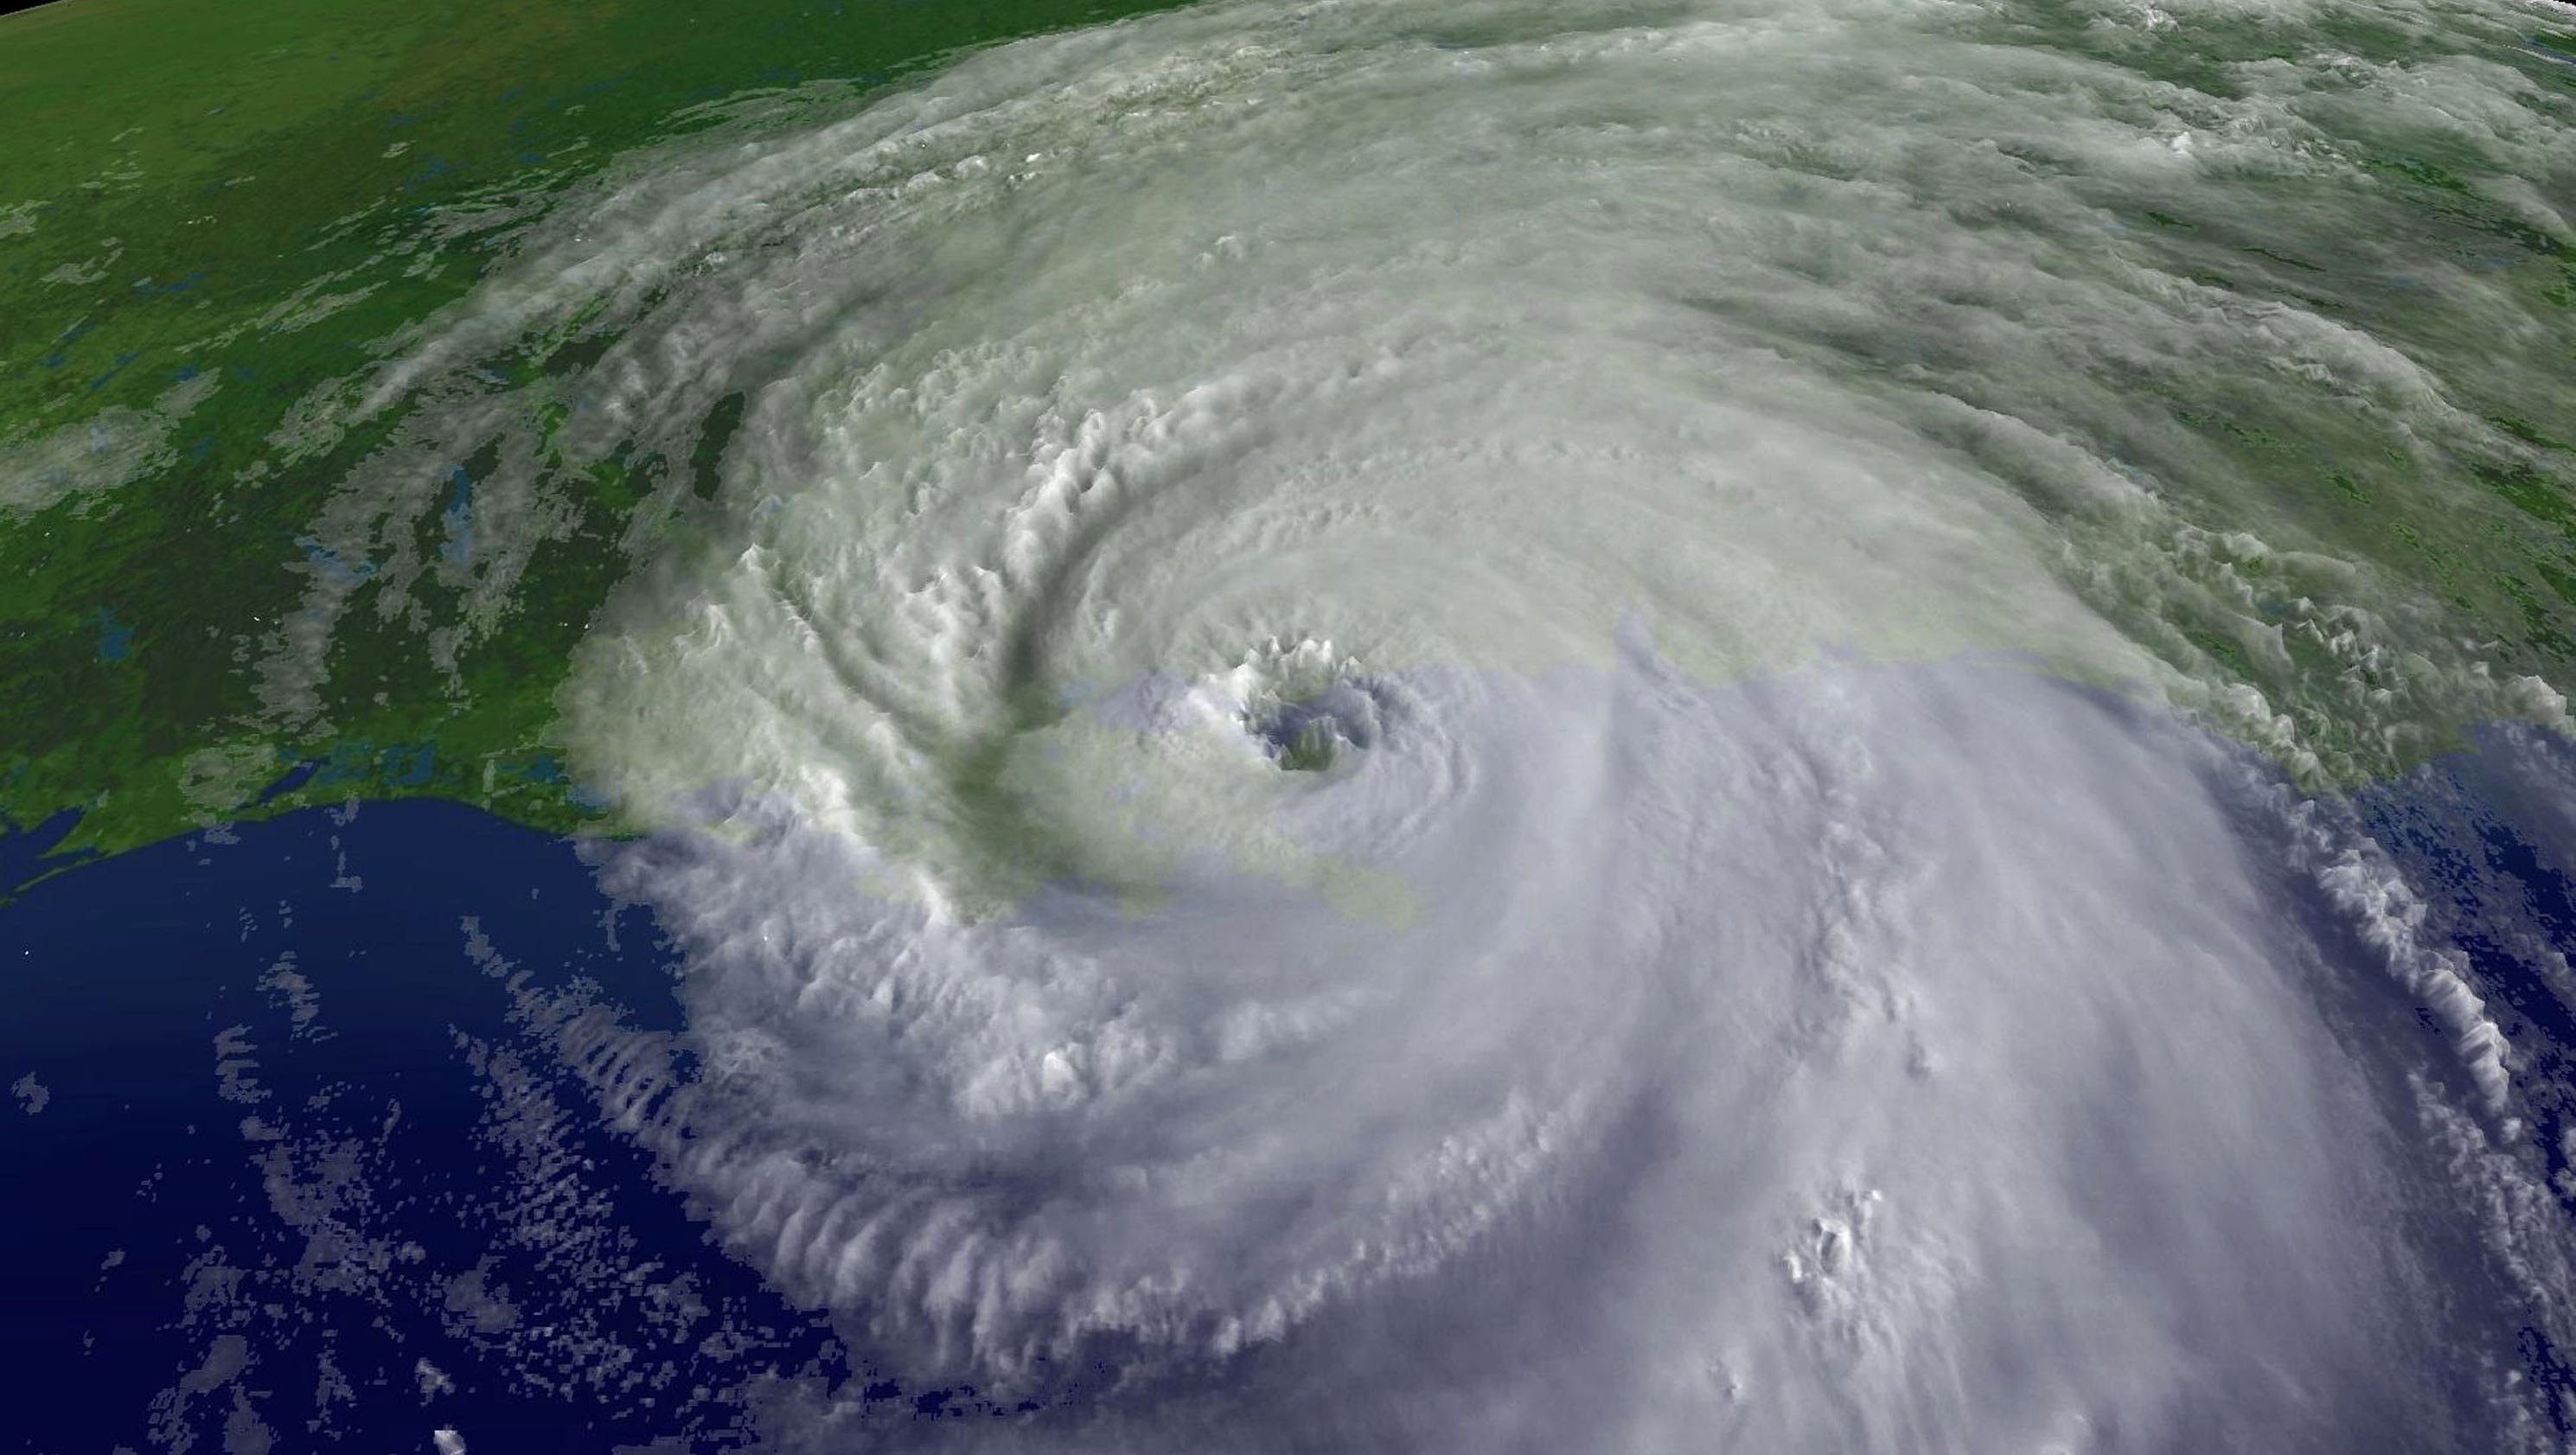
During late August and early September of 2005, Hurricane Katrina passed over New Orleans and wreaked devastation on the city. About a quarter of the residents could not or chose not to evacuate. For days they were stranded in poorly prepared federal shelters or within their homes. They watched as the canals winding through the city were destroyed and the water began to rise. Soon 80% of New Orleans was flooded and entire neighborhoods were destroyed. By the time the catastrophe was under control, 1,145 people had perished. In the aftermath, the city’s population was halved, and years passed before portions were rebuilt. Unfortunately, the reconstruction has led to gentrification and further inequality
I first chose to pursue this project after listening to a podcast sponsored by the Linguistics Society of America, Subtitle. A recent episode, Did Katrina Kill the New Orleans Accent?, made me consider the ongoing impact of the hurricane and how the tragedy was used to change a historically black city. Initially, I went into the project with guns blazing, furious at how the tragedy was handled. Now, after seeing so many images of floating corpses and weeping people, I’m both angry and very sad. I kept my information truthful and tried not to be gratuitously negative, but, I must admit, my site might be more biased than most of my scholarly work.
Although I originally focused specifically on gentrification in New Orleans rather than the events during the hurricane, but that changed for two reasons. First, scholarly work on the matter is minimal at best. Many experts studied New Orleans in the aftermath of Katrina and came to intelligent conclusions regarding the impact of race in the response to the tragedy. However, not much research can be done on gentrification until the 2020 Census information is available. The 2010 Census was less than five years after the storm and, while trends were evident, it was not enough data to form firm conclusions. Most of the information I discovered was through a few newspaper articles and videos made by unhappy New Orleanians. It’s worthwhile information, and I believe their arguments and conclusions, but it’s not enough to create an entire visualization project and Omeka portfolio.
My second reason is much more emotional and leans into my previous warning about potential bias. As I watched videos about Katrina and listened to audio clips of the tragedy, I was brought to tears a few times. Honestly, between COVID-19 and this project, the past few weeks have been a little emotionally draining. However, I think that makes it all the more important to share. The people who suffered through this tragedy deserve to be remembered. They deserve to have their story told and their faces seen. And the government definitely deserves to have their disorganized and ineffective response put on display. So, with this in mind, my site focuses heavily on the response to Katrina during the storm, in the aftermath, and throughout the following years. Within this, I incorporated information that points out racism and gentrification. Hopefully, once the 2020 Census information is released, I can continue my research and see if the trends continued.