Categories
Project: Visualization

Care For a Song?

My research focused on the lyrics of American presidential campaign songs.  While I personally wanted to do something with music history, I also wanted to explore what purpose music had in the grandest political machine in the country.  Ultimately, I had two major questions: how did the choice of song affect a candidate’s campaign, and did song selections among parties convey different messages?  I also wanted to keep this study fairly modern since the twentieth-century commodification of pop culture is a unique part of today’s campaigns.  Therefore, I went from Franklin Roosevelt to Donald Trump.  While my first question would be hard to answer visually, my second question could be done so.  Analyzing the songs’ lyrics could be done visually.  To do this, I needed to focus on text mining, and a tool which could show trends in text.  So I chose to use Voyant, which is a tool that takes the entirety of a text and shows a word scramble.  This enables somebody to look at the resulting image and identify the most frequent words that show up in the text, which can give an idea of a particular tone or message.  However, if ‘the’ showed up too much, it would be the biggest word which would show nothing.  So I did edit the lyrics I entered to get rid of such articles, as well as third-person pronouns.  I wanted to focus on the words which would actually convey a message, if possible.  Ultimately, I found that there were clear differences in the messages of the songs based on a party line.  Republican-chosen songs tended to include words which reinforced a message of country, freedom, and strength.  Democratic-chosen songs tended towards messages of hope and a can-do attitude.  This shows that there is a possibility at songs being chosen by candidates along broader ideas than personal affinity of the candidate. My findings can be seen at https://voyant-tools.org/?corpus=3c36fd03ac4fba22618fd1b8233bf3d4 for the total aggregate, https://voyant-tools.org/?corpus=7027e2b5011a493d55aa92a3d6948967 for the Republican-only aggregate, and https://voyant-tools.org/?corpus=bfdb07fcd8af93d003c2e02a48d048b7 for the Democratic-only aggregate of lyrics.

The historical scholarship on presidential campaigns music is scarce.  There are a few articles I found about nineteenth-century campaigns, but nothing that really helped for my chosen period.  My main sources were popular newspaper articles, such as USA Today, along with lyric pages for the actual song lyrics.

SOURCES

Griffiths, ,Michael. “American Presidential Campaign Songs That Have Backfired on the Candidates.” The Independent. February 19, 2016. https://www.independent.co.uk/arts-entertainment/music/features/american-presidential-campaign-songs-that-have-backfired-on-the-candidates-a6883811.html

Murse, Tom. “List of Campaign Songs Used by Presidential Candidates.” Thoughtco. August 14, 2019. https://www.thoughtco.com/list-of-presidential-campaign-songs-3367523

History – Music in Politics. 2020. https://wordpress.clarku.edu/musc210-mip/american-campaign-songs/history/

McDermott, Maeve. “Election Day Playlist: 15 Famous Campaign Songs.” USA Today. November 1, 2018. https://www.usatoday.com/story/life/music/2018/11/01/election-day-playlist-15-famous-campaign-songs/1833234002/

http://www.azlyrics.com

http://www.lyricfind.com
Categories
Project: Visualization

A Stitch in Time: Samplers

Samplers are a girlhood art, and for many, their only real chance at schooling. I started this project, wanting to look at how the samplers changed over time, containing it to a geographic region to limit my sample size and influence.

As for what has been written, there is not much, and most of it is old. The most recent source that I used came from 1991, and the earliest of which from 1921. The databases where I got the majority of my information from are much more recent. 

I focused my research on New England, leaving out the later developments in other areas of the country. I kept my research between a three hundred year period to get a more general sense of how the samplers had changed over time, becoming more elaborate and decorative, rather than just a place to copy patterns and stitches. 

My conclusion, after studying these samplers and the stitches, is that the samplers got more elaborate and complicated as the cost of making them went down, allowing for more thread and creativity, and an increase in girl’s education, allowing for more complex stitches and patterns to be used. The ages of the girls were usually somewhere between 10-15, done in whatever free time a girl had, as a way to practice letters, numbers, and stitching. The more elaborate, the better, with colors and stitches used, to better impress their community and any potential suitors.  

When looking into these samplers, I focused on the stitches the girl’s used, learning how to create the twelve most commonly used ones, as a way to see for myself what they girls did, and to show others how they were made, to show part of the process the girls did in making theirs.

Stitch Dictionary – https://www.flickr.com/photos/187319344@N08/albums

Categories
Project: Visualization

Lest We Forget: Surviving Katrina

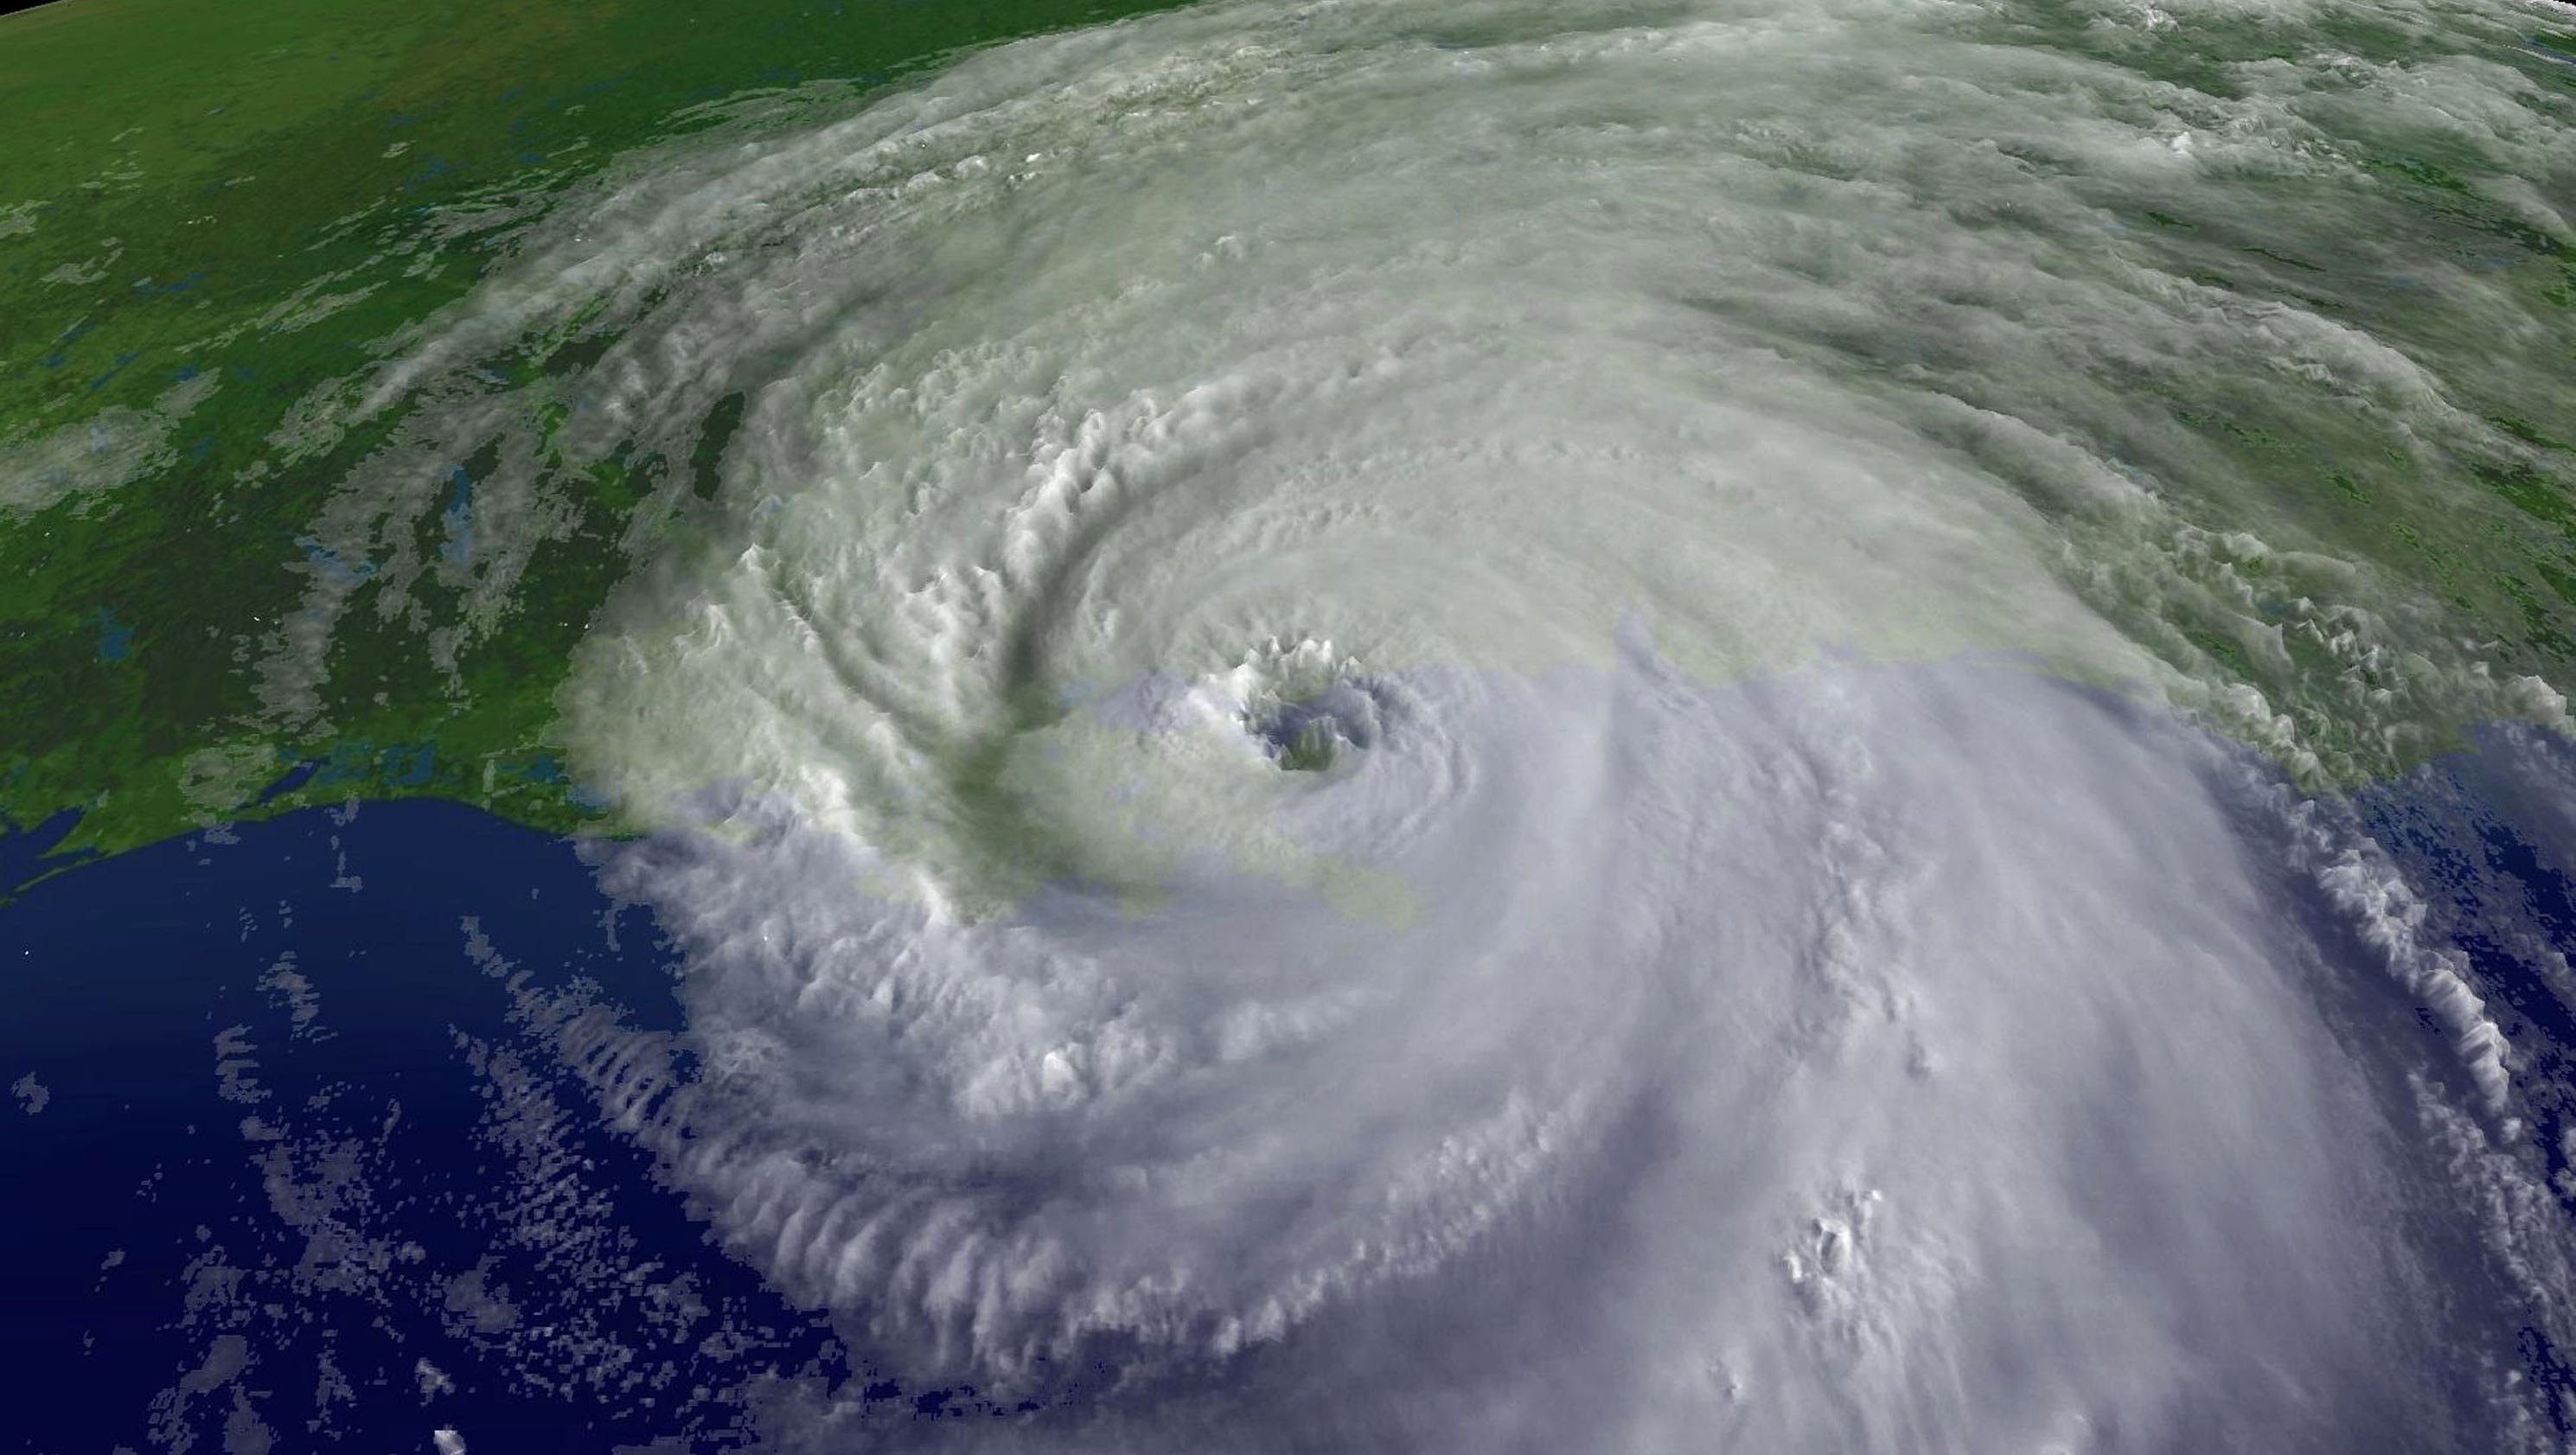
Images of Hurricane Katrina 10 years ago

During late August and early September of 2005, Hurricane Katrina passed over New Orleans and wreaked devastation on the city. About a quarter of the residents could not or chose not to evacuate. For days they were stranded in poorly prepared federal shelters or within their homes. They watched as the canals winding through the city were destroyed and the water began to rise. Soon 80% of New Orleans was flooded and entire neighborhoods were destroyed. By the time the catastrophe was under control, 1,145 people had perished. In the aftermath, the city’s population was halved, and years passed before portions were rebuilt. Unfortunately, the reconstruction has led to gentrification and further inequality

I first chose to pursue this project after listening to a podcast sponsored by the Linguistics Society of America, Subtitle. A recent episode, Did Katrina Kill the New Orleans Accent?, made me consider the ongoing impact of the hurricane and how the tragedy was used to change a historically black city. Initially, I went into the project with guns blazing, furious at how the tragedy was handled. Now, after seeing so many images of floating corpses and weeping people, I’m both angry and very sad. I kept my information truthful and tried not to be gratuitously negative, but, I must admit, my site might be more biased than most of my scholarly work.     

Although I originally focused specifically on gentrification in New Orleans rather than the events during the hurricane, but that changed for two reasons. First, scholarly work on the matter is minimal at best. Many experts studied New Orleans in the aftermath of Katrina and came to intelligent conclusions regarding the impact of race in the response to the tragedy. However, not much research can be done on gentrification until the 2020 Census information is available. The 2010 Census was less than five years after the storm and, while trends were evident, it was not enough data to form firm conclusions. Most of the information I discovered was through a few newspaper articles and videos made by unhappy New Orleanians. It’s worthwhile information, and I believe their arguments and conclusions, but it’s not enough to create an entire visualization project and Omeka portfolio.

Categories
Project: Visualization

Poverty and Homelessness; Stigma and Relief: Real World Solutions

This semester I researched poverty and homelessness in the United States of America’s history, specifically where the stigma around poverty and homelessness may have originated. I also explored possible effective solutions. For my Omeka Project I focused on the opinion of the public on poverty contemporary to Jane Addams, her creation of Hull house, and on aid the Works Progress Administration provided to those unemployed during the Great Depression. This naturally led to questions of: is the stigma still around today, how people are combating the stigma today, and how are cities and countries working to end poverty and homelessness within their borders?

The sources of information I utilized were varied and included historical documents, scholarly research papers, and publicly available videos. In one source a Helsinki, Finland study on the long-term life of homeless people was conducted by a group that checking in with participants a decade after they used a shelter where they were doing their study. This type of long-term study has not been done before as homeless people move from place to place, die, or find permanent housing. Additionally, I found that Jane Addams had written and given speeches tying crime to moral deficiency and implying those who needed social reform were morally deficient. Other reading revealed the Works Progress Administration was ended during World War II because of the societal stigma around poverty. I found a project in Finland called the Y-Foundation which gives homes to homeless people which may be model for possible solutions in the United States of America. Further toward possible American solutions the Salvation Army in La Crosse, Wisconsin is working to reduce the stigma around poverty and homelessness. Lastly, I found a Youtube channel called Invisible People that tells the story of the homeless people the founder meets. The lingering question I have as a result of my research is: what is the best way to inform the public and legislatures that more solutions to poverty and homelessness need implemented, including possibly theY-Foundation model?

Categories
Project: Visualization

American Women at War: Nurses of World War II

For my Omeka site, entitled “US Nurses in World War II,” I focused on trying to encapsulate the large narrative of the thousands of American women who served as healers during the Second World War. My goal was to learn more about the topic through this project, in order to help me come up with a research question for my MA thesis. The goal for the site and my visualization project was to expand the knowledge of the general public about the unique experiences these women had when serving at home and on the front during the war, and to show people that it was not a glamorous job. I want viewers to look through it and understand the deep impact these women had on the people they treated, those observing them, and the future of women in the US military.

The main research questions I had going into these projects were; Why did these women serve? Where did they serve? What was it like to be a nurse during World War II? How did they impact women’s history? How did they impact those that they cared for, and what does that say about their importance?

Many people feel that nurses during WWII were not breaking any gender barriers, and most women’s historians seem to spend more time praising and analyzing the women who stayed at home and entered the workforce, replacing men in factories and businesses, or the women who joined the military but did not serve as nurses. From what I have read so far in my historiography on my topic (I’m still in the early stages of it all), nurses are not seen as anything special to women’s history outside of the fact that they comforted and healed so many. Apparently, we already crossed that bridge with Civil War nursing, and so nothing after that is particularly striking in terms of the development of American women.

I am still trying to formulate the exact argument I will make, and the exact research questions I have, but one main thing that I can’t ignore is that I HATE this viewpoint that nurses in WWII contributed next to nothing to the narrative of American women’s history. I am a believer in agency, and as I argued in the last thesis I wrote, in undergrad, these women knew what they were doing. They saw an opportunity, and they took it for a reason. They were offered places in the military, normally closed to women, in an unprecedented amount during this war, and they got away with it more easily than the WACs, WAVES, SARS, and other female military personnel who chose roles that were not related to medicine.

Categories
Project: Visualization

Major Data Breaches

The history of data breaches began before companies started storing their data digitally. Back then, a data breach might consist of physical file theft or unauthorized personnel exposure. However, computers and the Age of Information Technology led to a higher frequency of data breaches in the 1980s. This has resulted in a rise of public awareness between the 1990s and early 2000s.

Since 2004, there have been 336 major data breaches- defined as a security event with a record loss of 30,000 records or more. Between these 336 data breaches alone, 27,837,914,908 records have been lost.

My visualization project aims to analyze these major data breaches by modeling a global data set sourced from Information is Beautiful. The questions the models are designed to answer are:

When have the largest data breaches occurred?
What sectors have been affected the most?
Which companies have lost the most records?
How has this data loss occurred?

What I discovered from this project is that the data is skewed towards two major security events. The first security event happened in 2013 with the hacking of Yahoo. Three years after the breach, Yahoo disclosed that one billion users accounts had been affected. Once acquired by Verizon Communications, it was announced that the number of records was triple that at three billion.

Categories
Project: Visualization

Stories Long Forgotten: Formerly Enslaved. (Omeka & Visualization Project)

This semester, I had the opportunity to be able to pick a research topic and find a unique way to not only display what I learned through a website but also through a visualization project. As someone whose introduction to history was through passed down oral histories of family members, I decided to pick a population of individuals who were at times forgotten and also caught in a living paradox (living parts of their lives enslaved and free). As someone who has read Slave Narratives, I understand the weird paradigm that they experienced. They were often seen as embarrassments to their family members (children, especially) because of being formerly enslaved and enduring a life that many could not dream of. Therefore, for my Omeka site, I documented the lives of 4 individuals who were interviewed by the WPA from 1936-1938 and were residents of North Carolina. These documents were found through various vital documents (marriage and death records) along with land deed information.

For my visualization project, I thought it would be cool to do a timeline specifically for one of the individuals that I documented throughout my Omeka site, however, I thought of something even different: a family tree. I decided to attempt to utilize the documentation that I have to find information not only about John Beckwith, but also his parents, siblings, children and nieces/nephews. One of the great things about Ancestry.com is the fact that its interface creates a timeline of their life along with maps of where they have been documented to live.

Categories
Project: Visualization

History Written In Explosives: Amateur Photography In The First North Carolina

During my research into the Spanish American War, I found a collection of images taken by an amateur photographer in the 1st Battalion of the 1st North Carolina Volunteers. These images had very little in the way of explication and context, so I have attempted to take a sample of these, and see what I could analyze from the composition and subject matter of the images. All the images were taken in a four month period in early 1899, when the unit was in Cuba, but that is it so far as contextualization.
https://photos.app.goo.gl/v7phvvhJZe5RG9G16

Categories
Project: Visualization

Roman Public Works and Parasites (Adobe Spark)

My research into the Public Works programs found in the Roman Empire led me to a new discussion on these public works. A couple of studies have been released that focus on the widespread problem of parasites in the Roman Empire. The arguments point out that since no treatment for water existed, water-borne parasites were free to spread like wildfire. There are also side points about garum (the fermented fish sauce) being a vector for food-borne parasites as the fish was not cooked. Additionally, the use of night soil and use of lice combs suggests the Roman’s public works were simply disease vectors.

I roundly reject the notion that the spread of parasites was a Roman issue compounded by Empire. Another study found the same intestinal parasites in a pre-Roman settlement in Switzerland of Celtic ethnicity. The parasites were already established prior to Roman excursion past the Po River Valley in the Republican era. Food-borne and soil-borne parasites that infected Romans were not unique to central Italy, let alone the rest of Europe, Africa, and Asia. My visualization reflects this, and I incorporated it into Adobe Spark.

Categories
Project: Visualization

Clio App and Hickory Ridge Living History Museum

For forty years the Southern Appalachian Historical Association has maintained the Hickory Ridge Living History Museum. Hickory Ridge is made up of six historical cabins from around Watauga County with each being used to portray a different aspect of life in the North Carolina Backcountry during the American Revolutionary War Period. Each cabin has its own unique history outside of what they portray. The program I used to showcase each cabin was the Clio App which allows users to place a digital marker on a map and then write an entry on what that marker is located at. There were already a few markers for the SAHA locations but none solely on the cabins. I placed six new markers foe each cabin then gave a brief history if each. This app is very beneficial since SAHA currently has no information on the grounds for each cabin unless visitors take a tour. With this app if a visitor is there while the museum is closed or in the current situation is shut down due to a virus, they can log in and see the history of the buildings.  

css.php